pdokr is for reading PDOK data. For the
background of a map — the reference topography under your own
layers — PDOK publishes its official basiskaart, and
pdok_basemap() hands you the URL for it. Nothing is
downloaded: you get a URL to pass to your mapping package, so it is
instant and works offline.
library(pdokr)
library(tmap)
library(sf)
#> Linking to GEOS 3.12.1, GDAL 3.8.4, PROJ 9.4.0; sf_use_s2() is TRUE
library(dplyr)
#>
#> Attaching package: 'dplyr'
#> The following objects are masked from 'package:stats':
#>
#>     filter, lag
#> The following objects are masked from 'package:base':
#>
#>     intersect, setdiff, setequal, union
library(mapgl)
library(leaflet)
Two kinds of basemap
pdok_basemap() returns one of two things, set by
format:
-
raster (the default) — a classic tile URL
(
{z}/{x}/{y}, PNG/JPEG). Works withtmap,leafletandmaplibre/mapgl. The safe, universal choice. -
vector — a Mapbox-GL style URL. Works with
maplibre/mapglonly, but stays razor-sharp at every zoom and can tilt into 3D.
pdok_basemap()                                # raster, default style
#> [1] "https://service.pdok.nl/brt/achtergrondkaart/wmts/v2_0/standaard/EPSG:3857/{z}/{x}/{y}.png"
pdok_basemap("grijs")                         # another raster style
#> [1] "https://service.pdok.nl/brt/achtergrondkaart/wmts/v2_0/grijs/EPSG:3857/{z}/{x}/{y}.png"
pdok_basemap("standaard", format = "vector")  # a vector style URL
#> [1] "https://api.pdok.nl/kadaster/brt-achtergrondkaart/ogc/v1/styles/standaard__webmercatorquad?f=mapbox"
The available styles differ per format:
format = "raster" |
format = "vector" |
|---|---|
standaard, grijs, pastel,
water, luchtfoto
|
standaard, zonder_labels,
luchtfoto, darkmode
|
(luchtfoto is aerial imagery.)
Raster basemaps — tmap & leaflet
Hand the URL to tm_basemap(). Here are the twelve
province outlines on the standard PDOK basemap — drawing only the
borders keeps the basemap readable:
provinces <- pdok_read(
  "cbs/gebiedsindelingen", "provincie_gegeneraliseerd", datetime = 2025
)
tmap_mode("view")
#> ℹ tmap modes "plot" - "view"
#> ℹ toggle with `tmap::ttm()`

tm_basemap(pdok_basemap("standaard")) +
  tm_shape(provinces) +
  tm_borders(col = "#E8631C", lwd = 1.5) +
  tm_credits("Kaartgegevens © Kadaster")
In plain leaflet the same URL is the
urlTemplate:
leaflet() |>
  addTiles(
    urlTemplate = pdok_basemap("standaard"),
    attribution = "Kaartgegevens © Kadaster"
  ) |>
  addPolygons(data = st_transform(provinces, 4326))
A raster basemap is ordinary web tiles, so it also works in
static maps: switch to tmap_mode("plot")
(or use ggplot2 with
maptiles/ggspatial) and the tiles are
downloaded and drawn into the image. The vector style, by contrast, is
rendered live in the browser, so it is interactive-only.
tmap_mode("plot")
#> ℹ tmap modes "plot" - "view"

utrecht <- filter(provinces, statnaam == "Utrecht")

tm_basemap(pdok_basemap("standaard")) +
  tm_shape(utrecht) +
  tm_borders(col = "#E8631C", lwd = 2) +
  tm_credits("Kaartgegevens © Kadaster")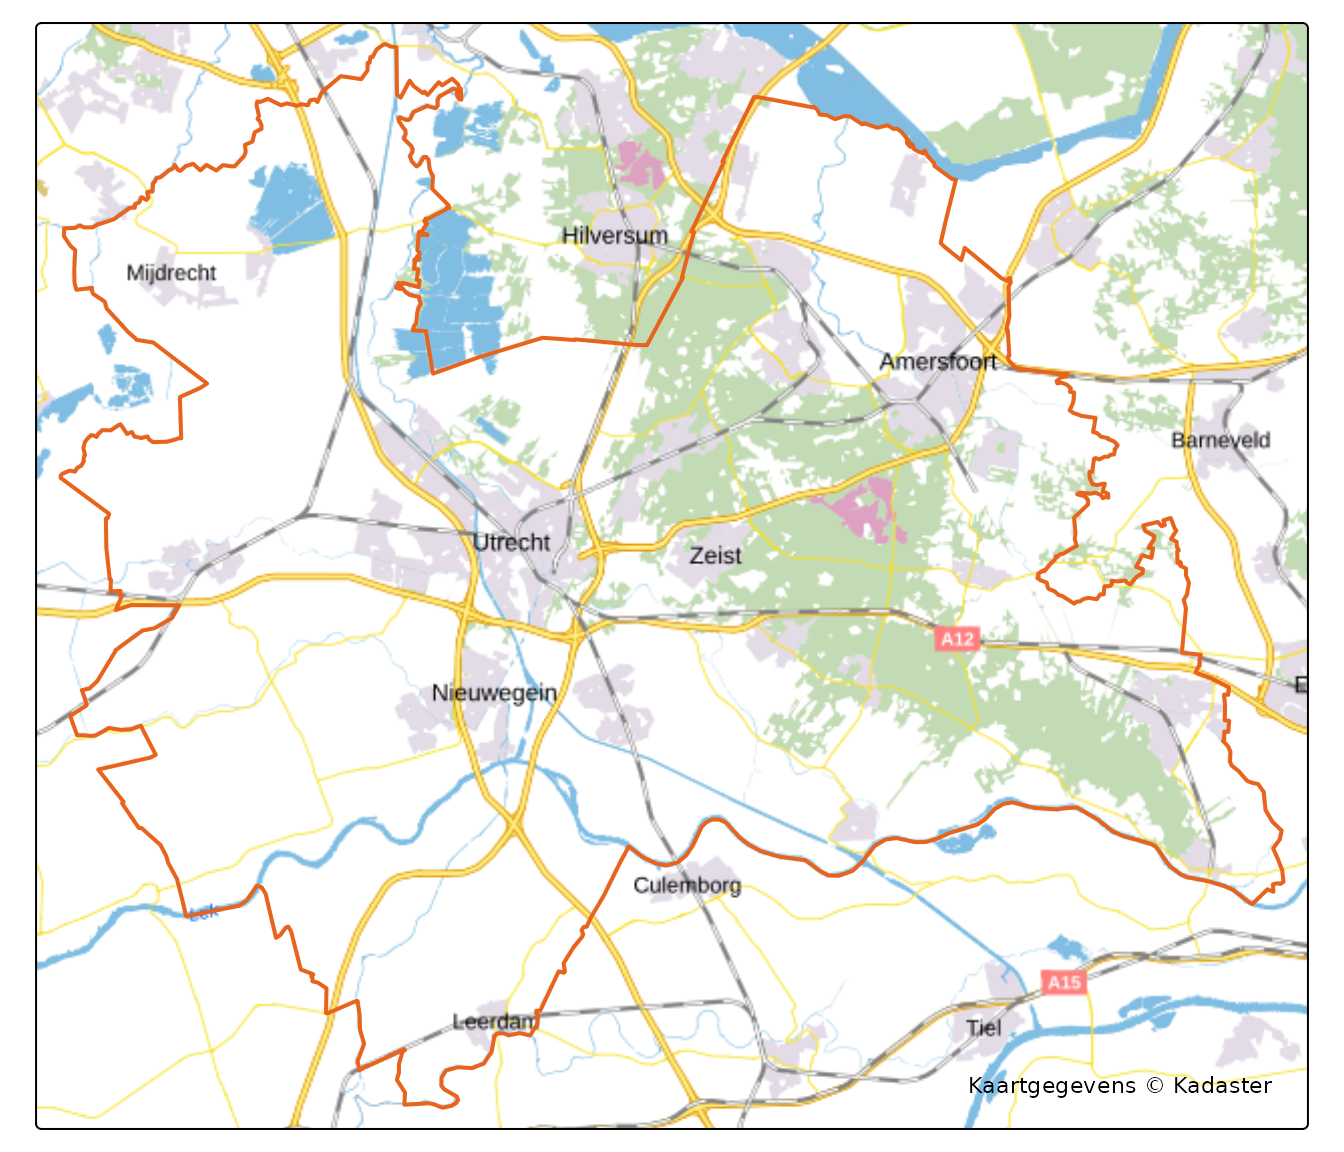
The styles, side by side
The five raster styles over the same spot in Utrecht. Each tab is
just
leaflet() |> addTiles(pdok_basemap("<style>")) —
only the style name changes.
Vector basemaps — maplibre / mapgl
mapgl
brings the MapLibre and Mapbox GL libraries to R: vector maps that stay
sharp at any zoom and can tilt into 3D. A GL map takes a style
URL — exactly what pdok_basemap(format = "vector")
returns.
maplibre(style = pdok_basemap("standaard", format = "vector")) |>
  add_line_layer(
    id = "provinces", source = provinces,
    line_color = "#E8631C", line_width = 2
  ) |>
  fit_bounds(provinces, animate = FALSE)
Which should I use?
| raster | vector | |
|---|---|---|
| Works in | tmap, leaflet, mapgl | maplibre / mapgl |
| Extra package | none (you likely have tmap or leaflet) | mapgl |
| Look | fixed tiles, fine for most maps | razor-sharp, tiltable, 3D-capable |
| Best for | quick maps, the common case | polished, interactive, 3D |
When in doubt, use the raster default — it works everywhere.
Attribution
The basemap data is © Kadaster / PDOK. Show this on any map that uses
it — via tm_credits() in tmap, the
attribution = argument in leaflet. The vector
style already carries its attribution, which
maplibre/mapgl displays.
Where to next
- Getting started — reading and mapping PDOK data.
-
Filtering data by area —
pdok_filter_by().