A very common task is “give me this layer, but only within that
area” — all national parks in a province, all wells in a
water-authority district, every building in a municipality. PDOK cannot
do this directly: its services can pre-filter by a rectangle (a bounding
box), but not by an arbitrary polygon. pdokr bridges that
gap, and pdok_read() makes it a one-liner.
library(pdokr)
library(tmap)
library(dplyr)
#>
#> Attaching package: 'dplyr'
#> The following objects are masked from 'package:stats':
#>
#>     filter, lag
#> The following objects are masked from 'package:base':
#>
#>     intersect, setdiff, setequal, union
Get a filter geometry
The area you filter by is just an sf polygon. The most
common source is the CBS administrative boundaries
("cbs/gebiedsindelingen"). Here we take the province of
Fryslân.
provinces <- pdok_read(
  "cbs/gebiedsindelingen", "provincie_gegeneraliseerd",
  datetime = 2025
)
fryslan <- filter(provinces, statnaam == "Fryslân")
Any polygon works, though: a nature reserve, a water-authority area,
a polygon you drew yourself, or a result from
pdok_geocode() (see the last section).
Filter another layer to that area
Pass the filter geometry to pdok_read() as
filter_by. It uses the polygon’s bounding box as a cheap
server-side pre-filter, then clips the result to the exact shape. Here
we keep only the national parks that lie within Fryslân.
parks <- pdok_read(
  "rvo/nationale-parken-geharmoniseerd", "protectedsite",
  filter_by = fryslan
)
parks$text
#> [1] "Lauwersmeer"        "Schiermonnikoog"    "De Alde Feanen"
#> [4] "Drents-Friese Wold"
A static map of the province with its national parks:
tmap_mode("plot")
#> ℹ tmap modes "plot" - "view"
#> ℹ toggle with `tmap::ttm()`

tm_shape(fryslan) +
  tm_borders(col = "grey40") +
  tm_shape(parks) +
  tm_polygons(fill = "text", fill.legend = tm_legend("National park")) +
  tm_title("National parks in Fryslân")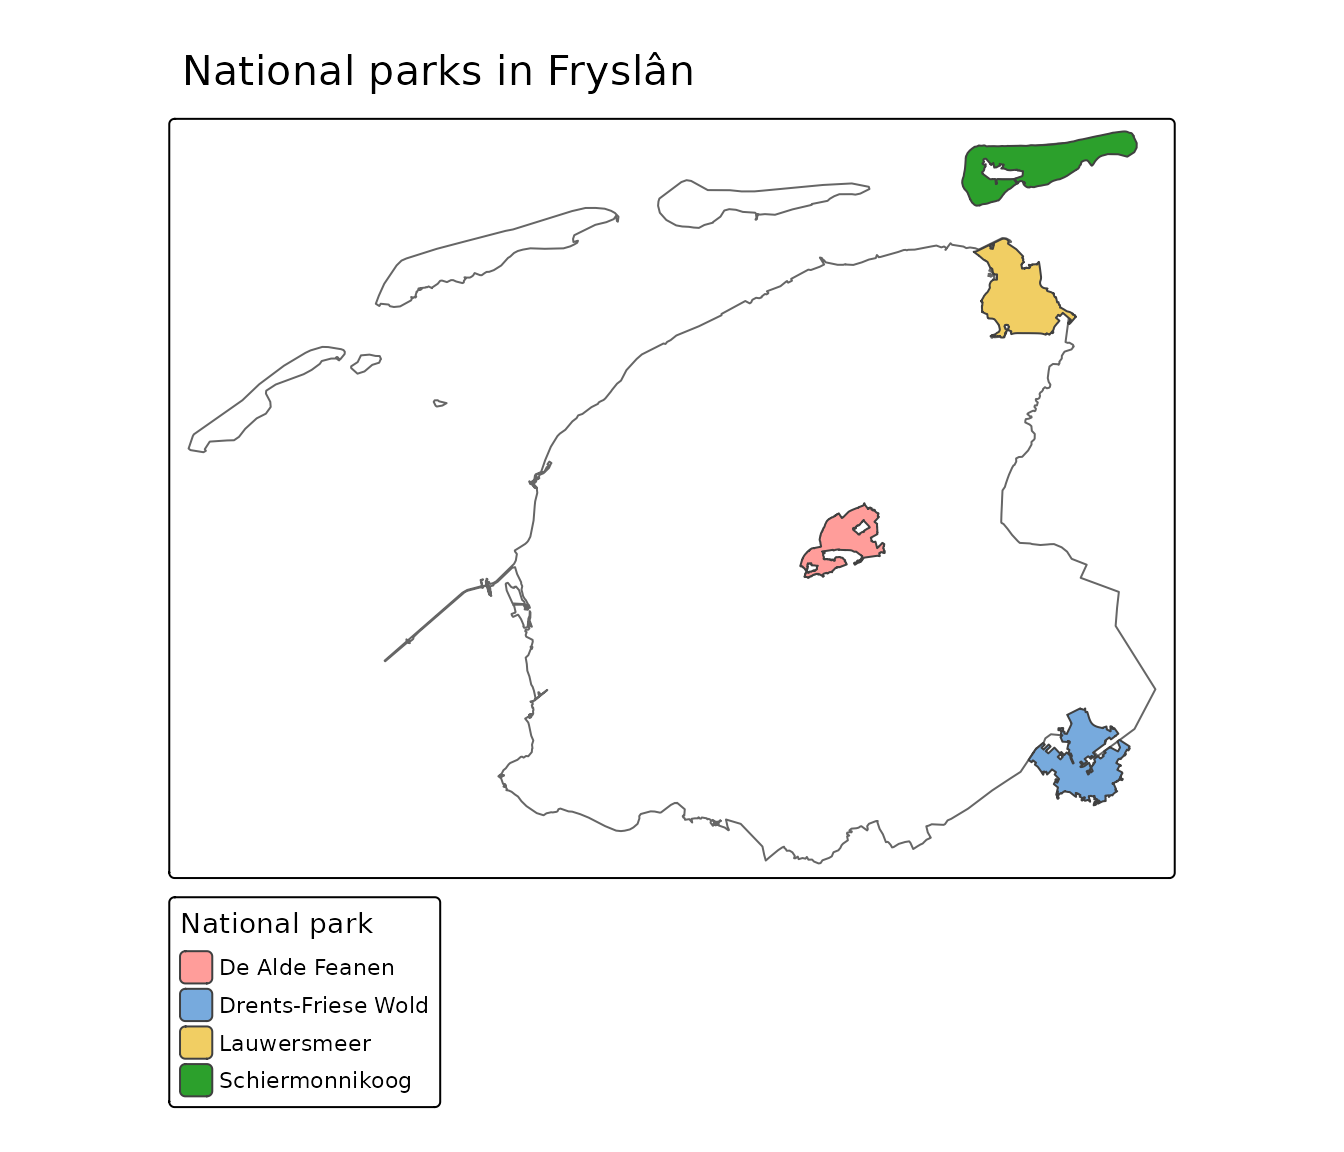
The same in interactive mode — zoom in and click a park:
tmap_mode("view")
#> ℹ tmap modes "plot" - "view"

tm_basemap(pdok_basemap("grijs")) +
  tm_shape(parks) +
  tm_polygons(fill = "text", fill_alpha = 0.6, id = "text",
              fill.legend = tm_legend("National park")) +
  tm_credits("Kaartgegevens © Kadaster")
What happens under the hood
filter_by folds a two-stage workflow into one call. You
can also run the two stages yourself, which is useful when you want to
reuse the pre-filtered data or apply a different spatial predicate.
# Stage 1: cheap server-side pre-filter by the bounding box of Fryslân
parks_in_bbox <- pdok_read(
  "rvo/nationale-parken-geharmoniseerd", "protectedsite",
  bbox = fryslan
)

# Stage 2: exact client-side clip to the polygon
pdok_filter_by(parks_in_bbox, fryslan)$text
#> [1] "Lauwersmeer"        "Schiermonnikoog"    "De Alde Feanen"
#> [4] "Drents-Friese Wold"
pdok_filter_by() reconciles coordinate reference systems
for you and accepts a predicate that sets how a
feature must relate to the area to be kept: "intersects"
(the default — touching the area in any way), "within"
(lying entirely inside it), "contains",
"disjoint" (everything outside), and the more specialized
"overlaps", "touches", "crosses",
"covers" and "covered_by". Each maps to the
matching sf function
sf::st_<predicate>(); see ?sf::geos_binary_pred
for the precise definition of each. The plain-sf
equivalent, once both objects share a CRS, is:
fryslan_ll <- sf::st_transform(fryslan, sf::st_crs(parks_in_bbox))
parks_in_bbox[fryslan_ll, , op = sf::st_intersects]$text
#> [1] "Lauwersmeer"        "Schiermonnikoog"    "De Alde Feanen"
#> [4] "Drents-Friese Wold"
From an address to its area
Because filter_by also accepts a point, you can answer
“which municipality is this address in?” Geocode the address
with pdok_geocode(), then filter the municipalities by that
point.
address <- pdok_geocode("Tweebaksmarkt 52, Leeuwarden")

pdok_read(
  "cbs/gebiedsindelingen", "gemeente_gegeneraliseerd",
  datetime = 2025, filter_by = address
)$statnaam
#> [1] "Leeuwarden"
The same idea scales up: geocode a place as a polygon (for example
pdok_geocode("Fryslân", type = "provincie")) and use it
directly as filter_by.
Where to next
- Geocoding — turn a place name into the boundary you filter by.
- Mapping buildings by construction year — read a BAG layer inside an area.
- Thematic maps from CBS statistics — a choropleth for one municipality’s neighborhoods.
- PDOK basemaps — the gray background map used here, and the other styles.