pdokr helps you work with open geographic data from PDOK, the national geodata platform of
the Netherlands. A typical session has three steps: find a dataset and
its layers, load a layer as an sf object, and
take it from there.
Find a dataset
PDOK serves many datasets. Search them by a partial, case-insensitive
term with pdok_search_datasets(), or list them all with
pdok_list_datasets().
pdok_search_datasets("gebiedsindelingen")
#> # A tibble: 2 × 7
#>   id                           name  description keywords services owner ogc_url
#>   <chr>                        <chr> <chr>       <list>   <chr>    <chr> <chr>
#> 1 cbs/gebiedsindelingen-histo… CBS … Deze servi… <chr>    ogc      cbs   https:…
#> 2 cbs/gebiedsindelingen        CBS … Deze servi… <chr>    ogc      cbs   https:…
The id column is what the rest of the package uses. Here
we will use the CBS administrative boundaries,
"cbs/gebiedsindelingen".
List the layers in a dataset
A dataset contains one or more layers. List them with
pdok_list_layers() (or filter them with
pdok_search_layers()).
pdok_list_layers("cbs/gebiedsindelingen")
#> # A tibble: 63 × 9
#>    dataset layer title description start_date end_date crs    storage_crs bbox
#>    <chr>   <chr> <chr> <chr>       <date>     <date>   <list>       <int> <list>
#>  1 cbs/ge… arbe… Arbe… Een indeli… 2016-01-01 NA       <int>        28992 <dbl>
#>  2 cbs/ge… arbe… Arbe… arbeidsmar… 2016-01-01 NA       <int>        28992 <dbl>
#>  3 cbs/ge… arro… Arro… De arrondi… 2016-01-01 NA       <int>        28992 <dbl>
#>  4 cbs/ge… arro… Arro… arrondisse… 2016-01-01 NA       <int>        28992 <dbl>
#>  5 cbs/ge… buur… Buur… Onderdeel … 2016-01-01 NA       <int>        28992 <dbl>
#>  6 cbs/ge… buur… Buur… buurt_labe… 2016-01-01 NA       <int>        28992 <dbl>
#>  7 cbs/ge… buur… Buur… buurtnietg… 2016-01-01 NA       <int>        28992 <dbl>
#>  8 cbs/ge… coro… Coro… De COROP-g… 2016-01-01 NA       <int>        28992 <dbl>
#>  9 cbs/ge… coro… Coro… coropgebie… 2016-01-01 NA       <int>        28992 <dbl>
#> 10 cbs/ge… coro… Coro… De COROP-p… 2016-01-01 NA       <int>        28992 <dbl>
#> # ℹ 53 more rows
Each row carries its dataset, the layer id
you pass to pdok_read(), the period the layer covers
(start_date / end_date), and the coordinate
reference systems it offers.
Load a layer
pdok_read() loads a layer as an sf object,
handling pagination for you. The CBS boundaries hold every year in one
layer, so we select 2025 with datetime.
gemeenten <- pdok_read(
  "cbs/gebiedsindelingen", "gemeente_gegeneraliseerd",
  datetime = 2025
)
gemeenten
#> Simple feature collection with 342 features and 8 fields
#> Geometry type: MULTIPOLYGON
#> Dimension:     XY
#> Bounding box:  xmin: 3.358378 ymin: 50.75037 xmax: 7.227498 ymax: 53.55405
#> Geodetic CRS:  WGS 84
#> # A tibble: 342 × 9
#>    einddatum              id jaarcode jrstatcode rubriek  startdatum
#>  * <dttm>              <int>    <int> <chr>      <chr>    <dttm>
#>  1 2025-12-31 23:59:59     1     2025 2025GM0014 gemeente 2025-01-01 00:00:00
#>  2 2025-12-31 23:59:59     2     2025 2025GM0034 gemeente 2025-01-01 00:00:00
#>  3 2025-12-31 23:59:59     3     2025 2025GM0037 gemeente 2025-01-01 00:00:00
#>  4 2025-12-31 23:59:59     4     2025 2025GM0047 gemeente 2025-01-01 00:00:00
#>  5 2025-12-31 23:59:59     5     2025 2025GM0050 gemeente 2025-01-01 00:00:00
#>  6 2025-12-31 23:59:59     6     2025 2025GM0059 gemeente 2025-01-01 00:00:00
#>  7 2025-12-31 23:59:59     7     2025 2025GM0060 gemeente 2025-01-01 00:00:00
#>  8 2025-12-31 23:59:59     8     2025 2025GM0072 gemeente 2025-01-01 00:00:00
#>  9 2025-12-31 23:59:59     9     2025 2025GM0074 gemeente 2025-01-01 00:00:00
#> 10 2025-12-31 23:59:59    10     2025 2025GM0080 gemeente 2025-01-01 00:00:00
#> # ℹ 332 more rows
#> # ℹ 3 more variables: statcode <chr>, statnaam <chr>,
#> #   geometry <MULTIPOLYGON [°]>
Make a map
The result is a plain sf object, so any mapping package
works. We use tmap. A static
overview:
library(tmap)
tmap_mode("plot")
#> ℹ tmap modes "plot" - "view"
#> ℹ toggle with `tmap::ttm()`

tm_shape(gemeenten) +
  tm_polygons(fill = "grey95", col = "grey40", lwd = 0.4) +
  tm_title("Dutch municipalities, 2024")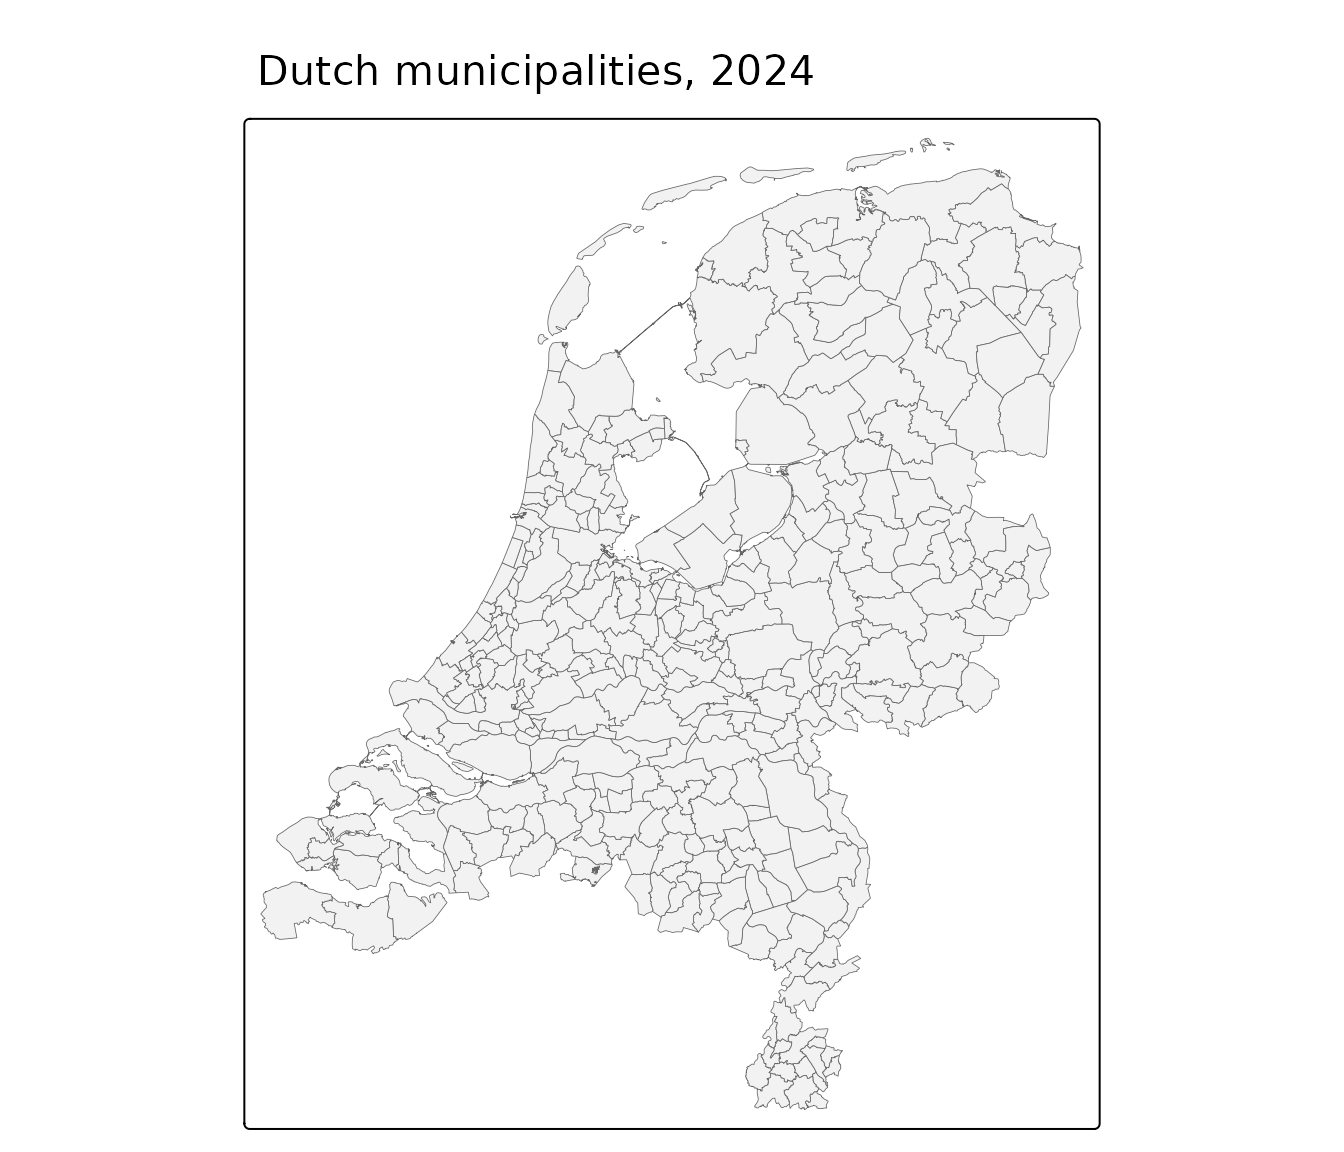
The same code in tmap’s interactive mode gives a
zoomable, pannable map you can hover over — try it:
tmap_mode("view")
#> ℹ tmap modes "plot" - "view"

tm_basemap(pdok_basemap("grijs")) +
  tm_shape(gemeenten) +
  tm_polygons(fill = "red", fill_alpha = 0, col = "red", lwd = 0.8,
              id = "statnaam") +
  tm_credits("Kaartgegevens © Kadaster")
Where to next
-
Filtering data by area — filter
a layer to a municipality, province, or any polygon, including the
address-to-area workflow with
pdok_geocode(). -
Coordinate reference
systems — how
pdokrhandles RD New and lon/lat. - Working with PDOK by hand — the raw OGC API and WFS requests the package automates.
- PDOK basemaps — the gray background map used here, and the other styles.